psad Graphs of the Honeynet Scan34 Challenge

The Honeynet Scan34 results have long since been posted. The purpose of this page is not to duplicate that excellent work - it is designed to illustrate the power of visualizing security data to bolster security analysis
Automating the analysis of the Scan34 challenge iptables logfile was done with psad in logfile analysis mode ("psad -A -m <file>"). A portion of this output can be viewed online here: psad Scan34 analysis, or the complete version downloaded here: here.
All graphs on this page were generated by using psad in --CSV to send data to AfterGlow; the specific commands used appear after each graph. As with the Scan30 analysis, the following color scheme applies to all graphs on this page unless otherwise noted:
| RED | - IP addresses external to the honeynet (attackers, scanners, etc.) |
| YELLOW | - Honeynet IP addresses |
| BLUE | - Port numbers (> 1024) |
| LIGHTBLUE | - Port numbers (<= 1024) |
Traffic Originating From the Honeynet
As mentioned in the Scan30 analysis, one of the first things to examine when looking for signs of a compromise are connections that originate from the honeynet. According to the challenge information, all IP addresses associated with the honeynet begin with 11.11.*.* (actually there only addresses in the 11.11.79.0/24 range), with DNS servers changed to 22.22.22.* and 23.23.23.*, and some other IP addresses changed to 10.22.*.*. The first graph below is a display of all packets/connections that come from honeynet IP addresses. Just by looking at the graph it becomes immediately apparent that the honeynet IP address 11.11.79.67 is the most vigorous initiator of outbound connnections and traffic (assuming a reasonable iptables policy that does not, say, log only ACK packets coming from the honeynet). Further, 11.11.79.67 is connecting to SSH (port 22) and IRC (port 6667) servers on external addresses, and this implies there is a good chance this host was compromised. Another interesting piece of information is the fact that the --log-prefix iptables command line argument was used to build the iptables logging rule, and psad has summarized all of the logging prefixes here.
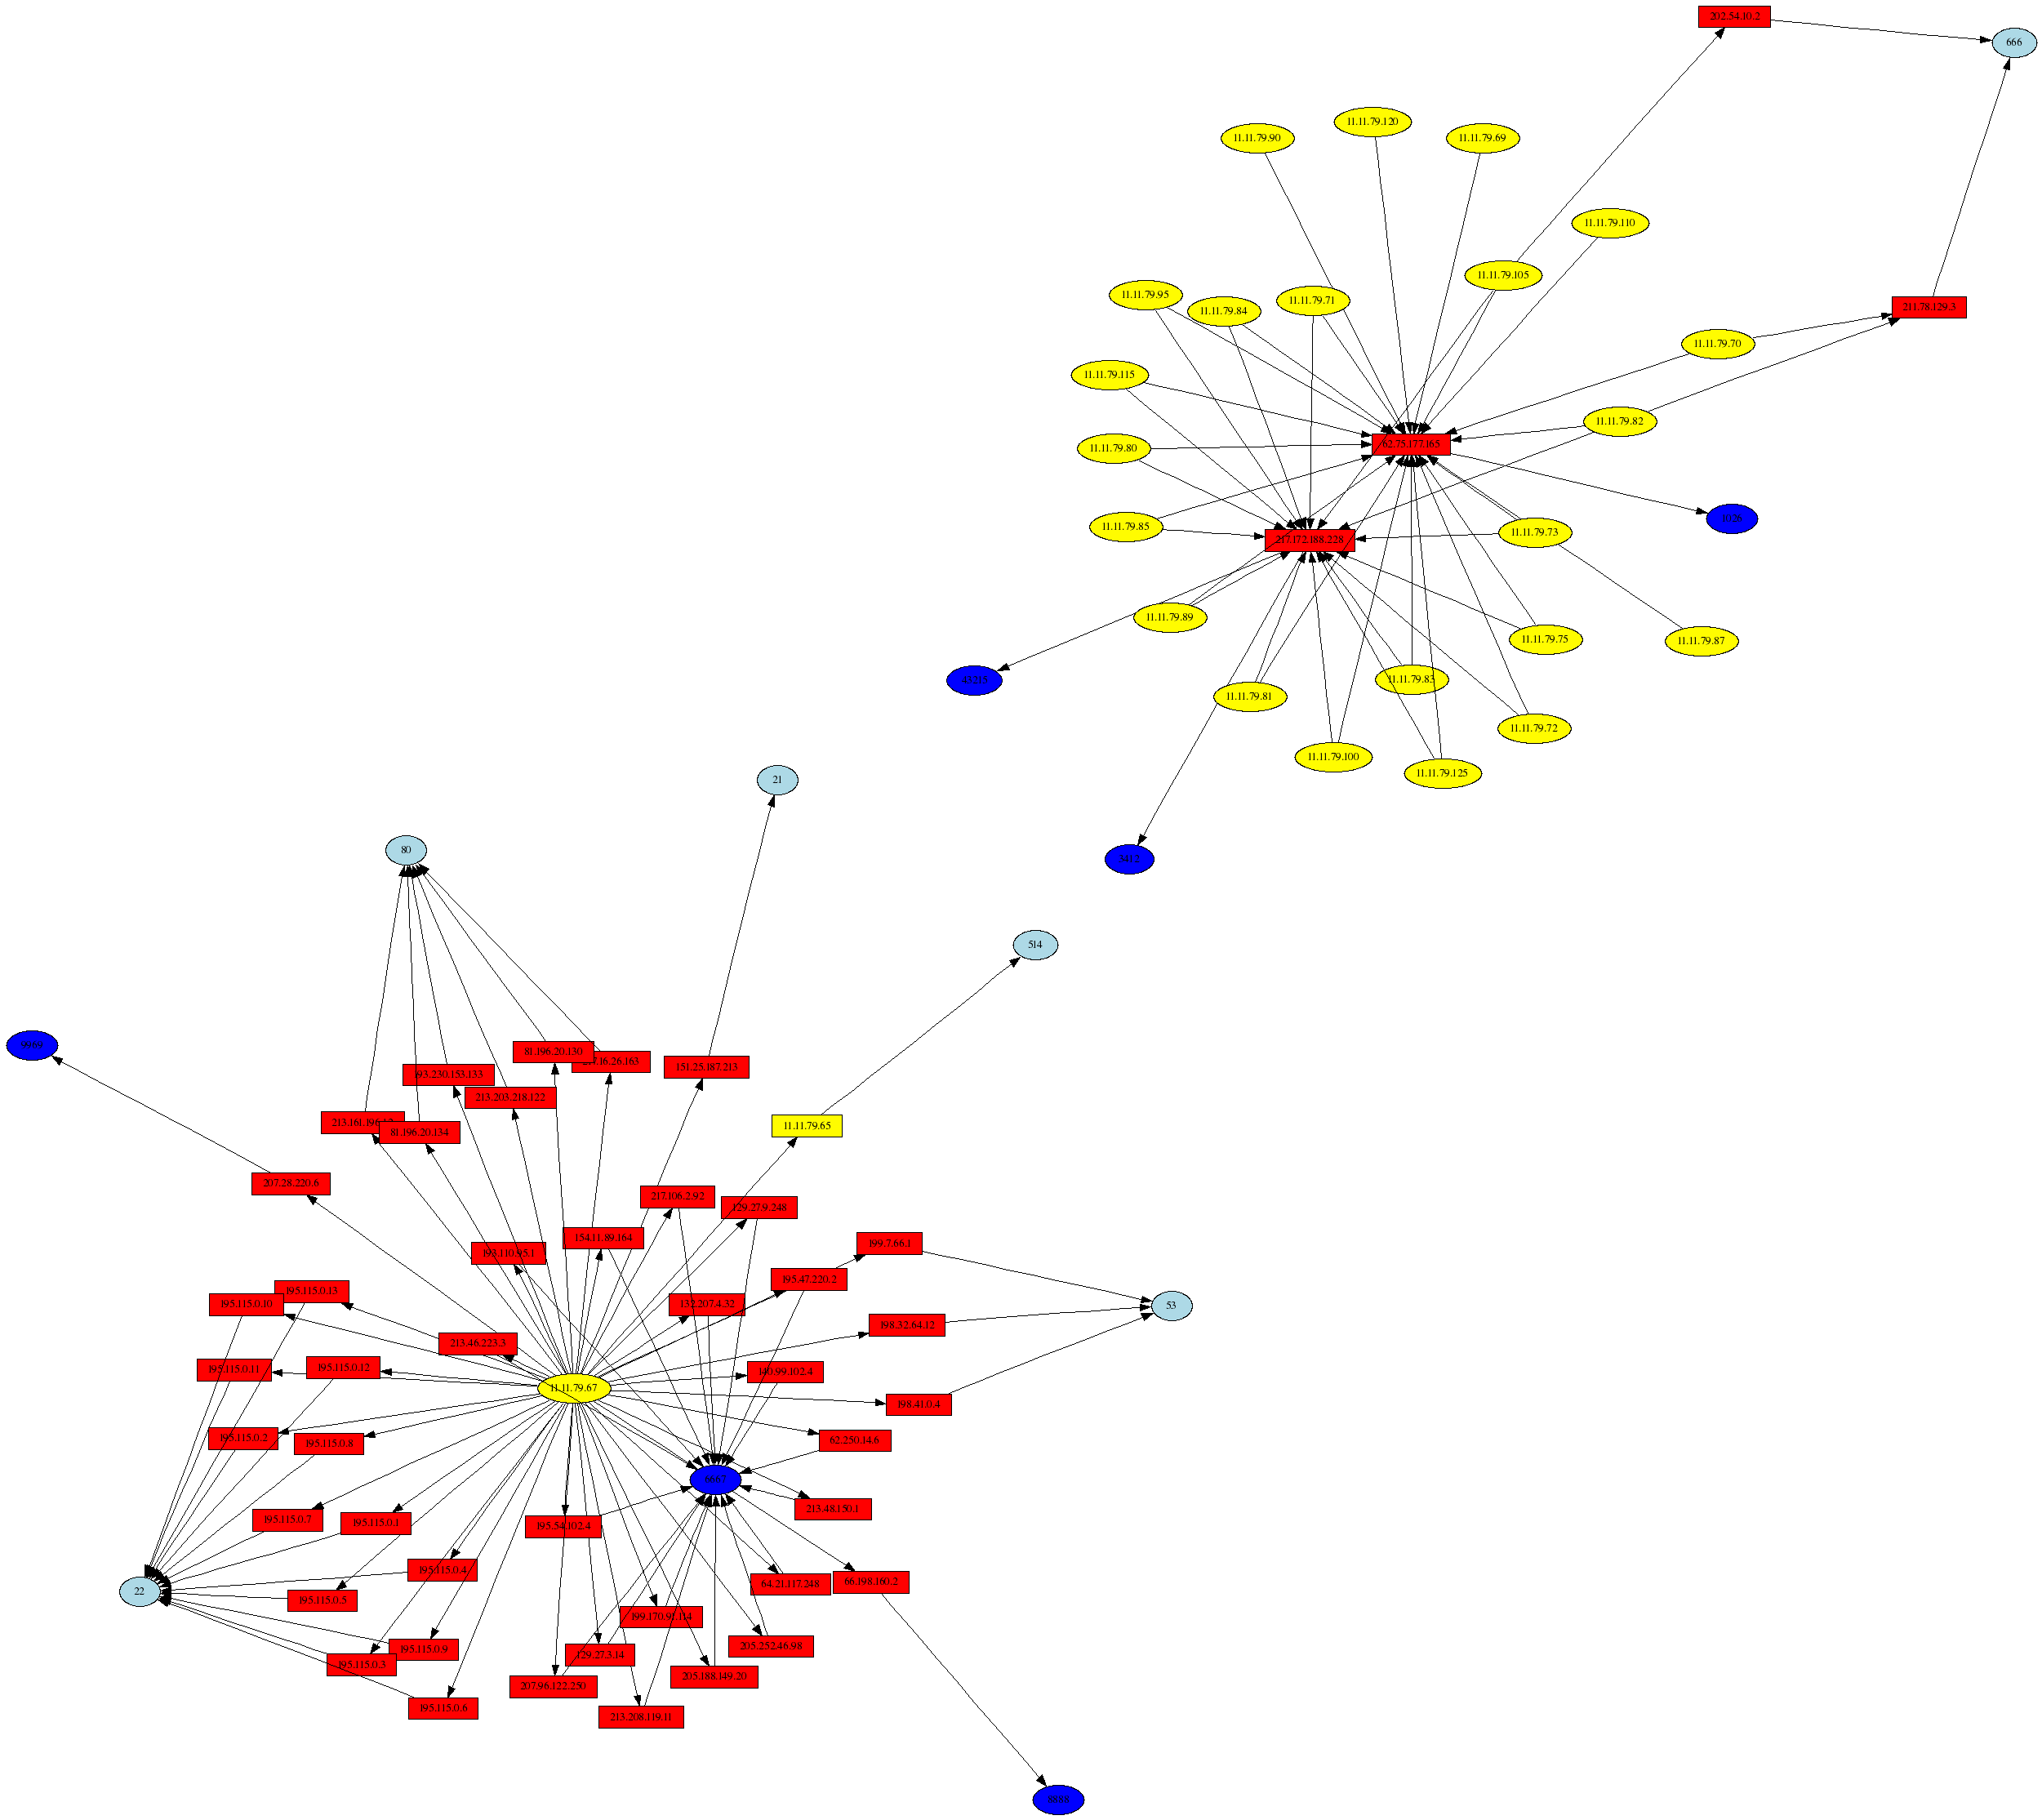
# psad --CSV -m iptablessyslog --CSV-fields "src:11.11.79.0/24 dst dp" \
| perl afterglow.pl -c color.properties |neato -Tgif -o general.gif
Compromised Host 11.11.79.67
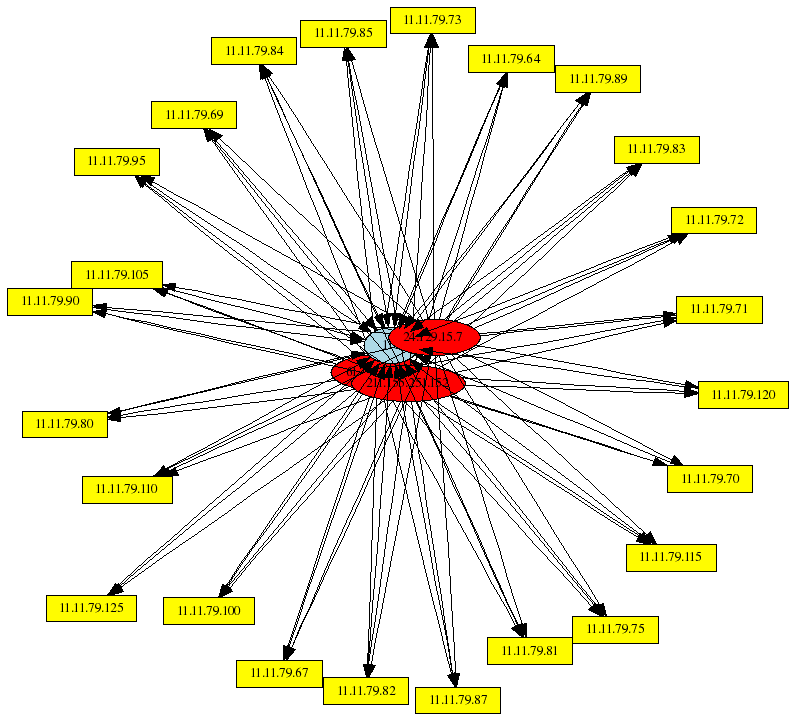
The next graph shows communications that are either destined for or originate from 11.11.79.67 (note the use of the psad --CSV-regex command line argument below so that either the source or destination IP must match 11.11.79.67). The large clump of external addresses show the internal communications towards 11.11.79.67, and the remainder shows the outbound connections to external addresses.
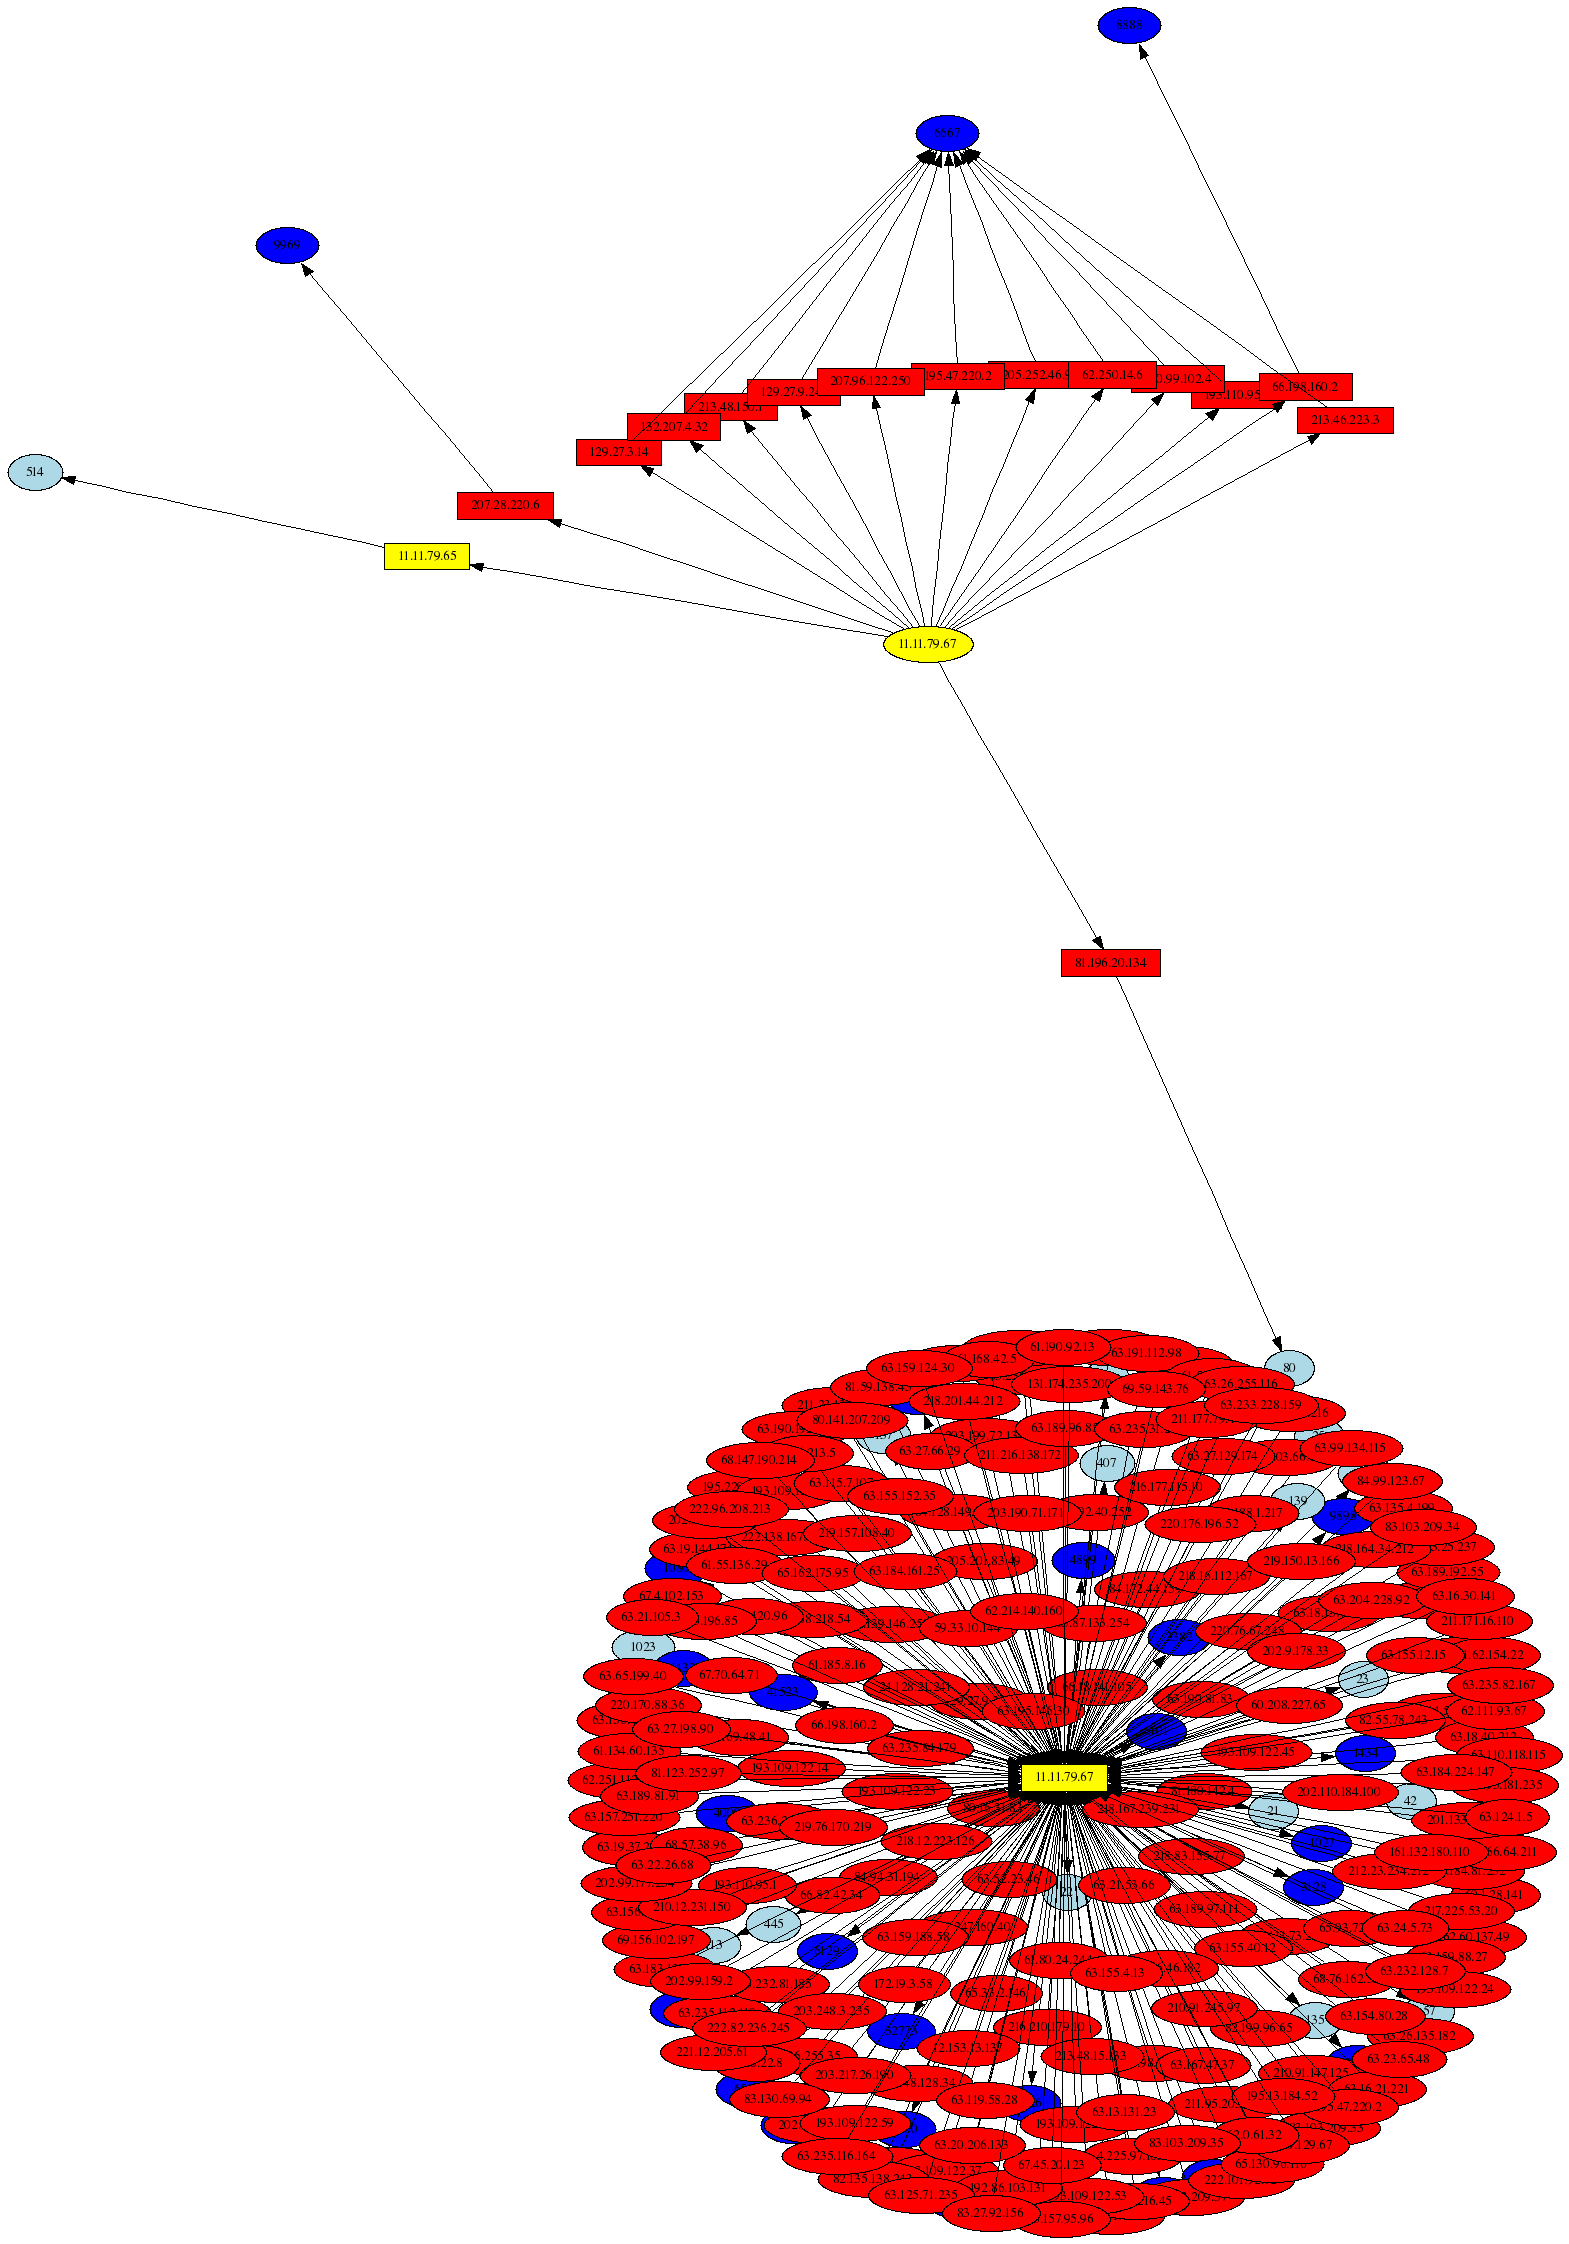
# psad --CSV -m iptablessyslog --CSV-fields "src dst dp" --CSV-max 600  \
| --CSV-regex 11.11.79.67 perl afterglow.pl -c color.properties |neato -Tgif -o general.gif
Slammer Worm
The next graph shows traffic associated with the Slammer worm against the 11.11.79.0 subnet. Note that there were too many packets from Slammer to represent on a single graph, so the output is limited to 100 packets with the psad --CSV-max command line argument.
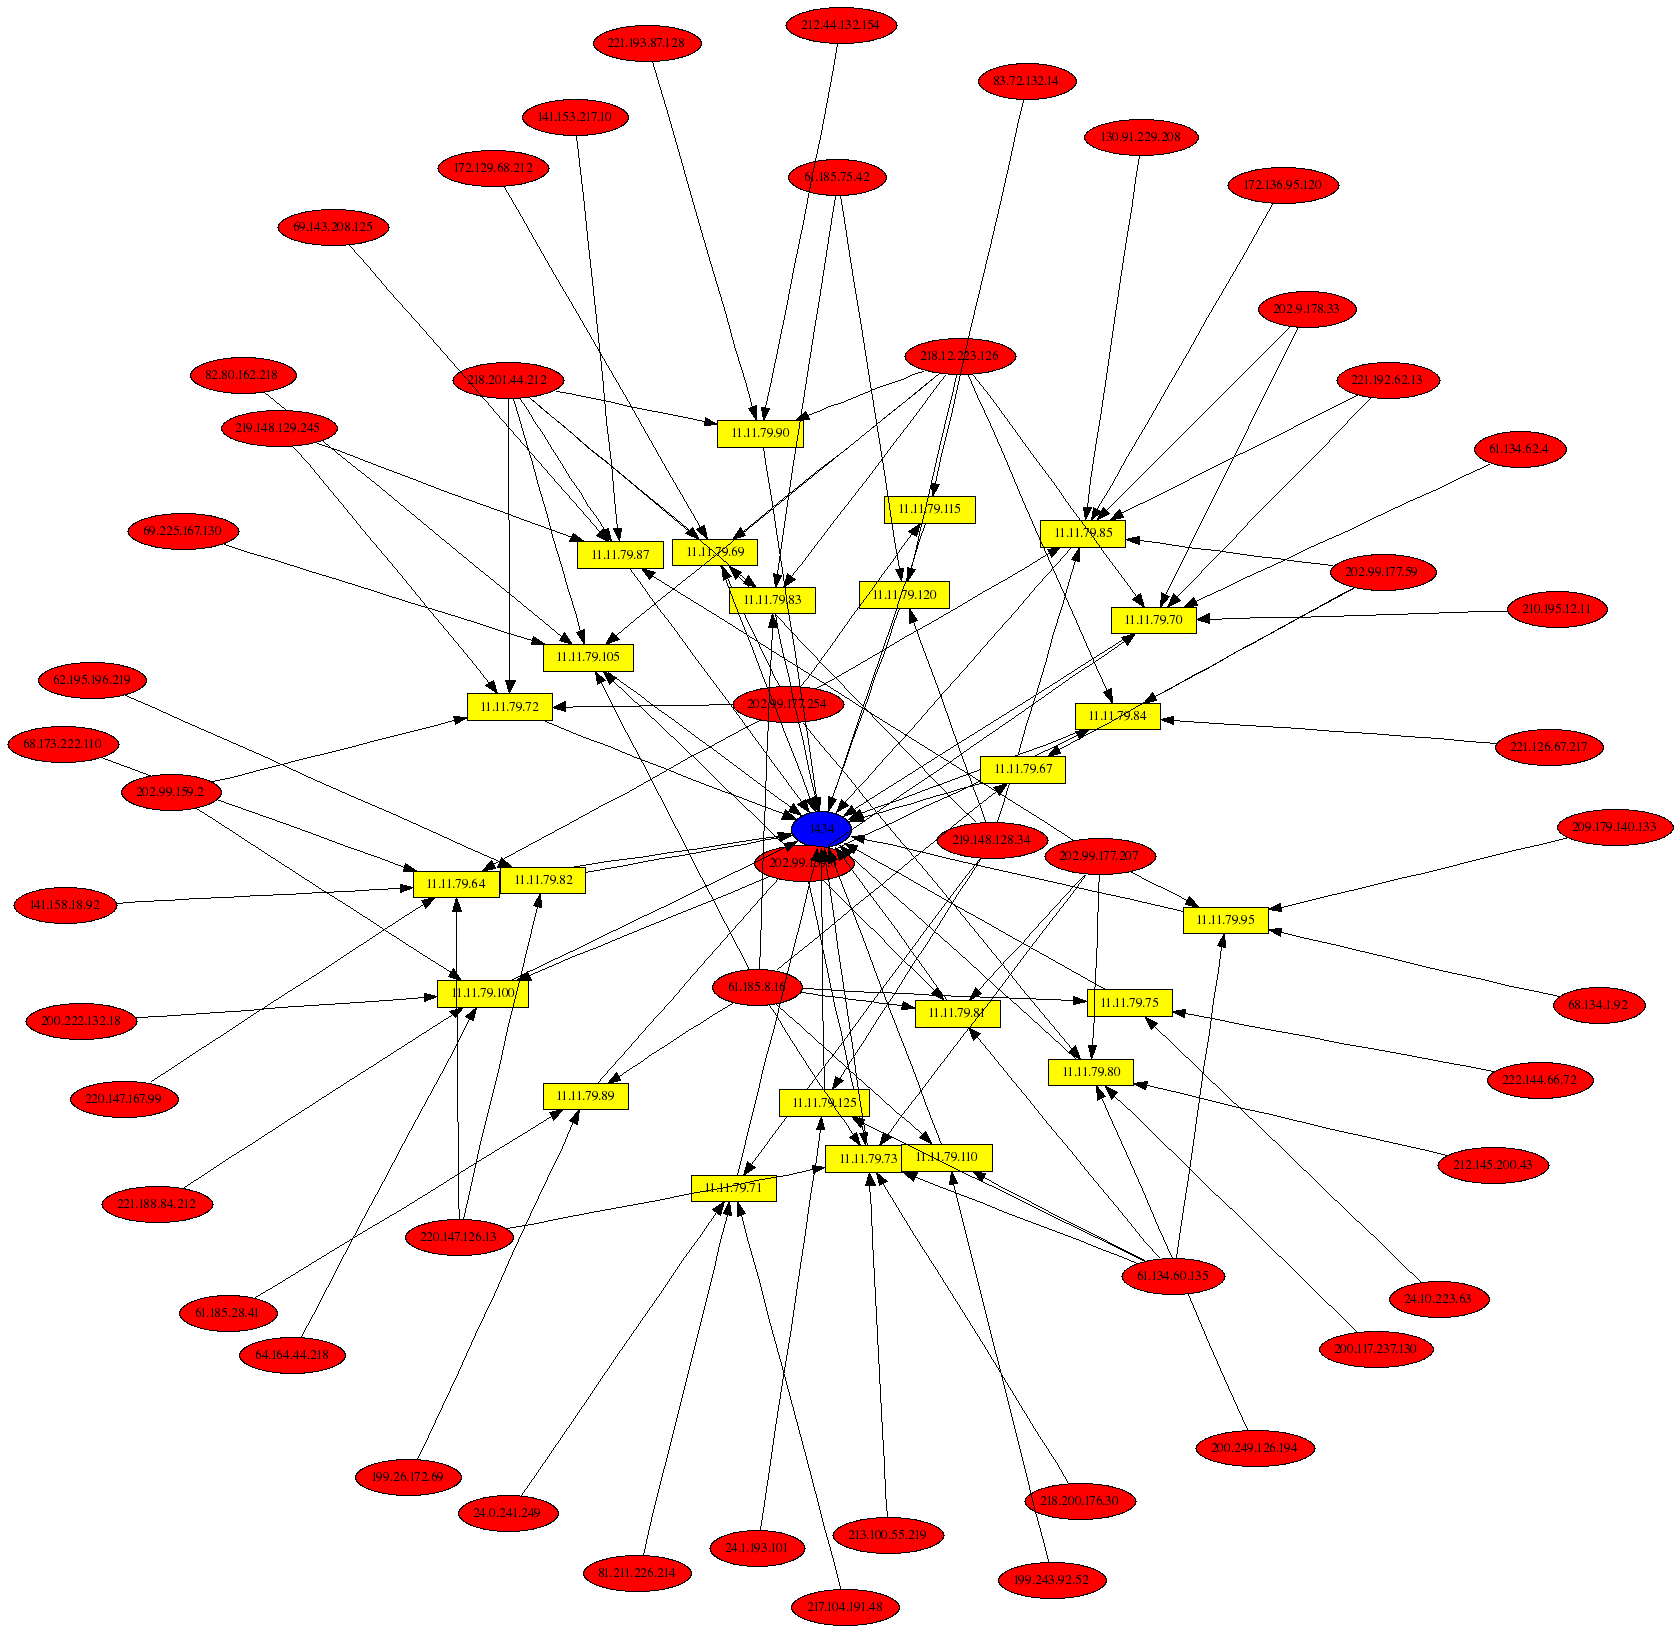
# psad --CSV -m iptablessyslog --CSV-fields "src dst dp:1434" \
--CSV-max 100 | perl afterglow.pl -c color.properties |neato -Tgif -o slammer_worm.gif
Nachi Worm
The next graph shows traffic associated with the Nachi worm against the 11.11.79.0 subnet. The Nachi worm sends 92 byte (including the IP header) ICMP type 8 packets (see this for a good writeup on the Nachi worm). The graph displays 300 packets by using the psad --CSV-max command line argument, and note the use of the --CSV-regex option to ensure that the graph only contains ICMP type 8 packets. Also, note that in the field criteria we specify the ip_len field instead of the destination port number, i.e. "src dst:11.11.79.0/24 ip_len:92".
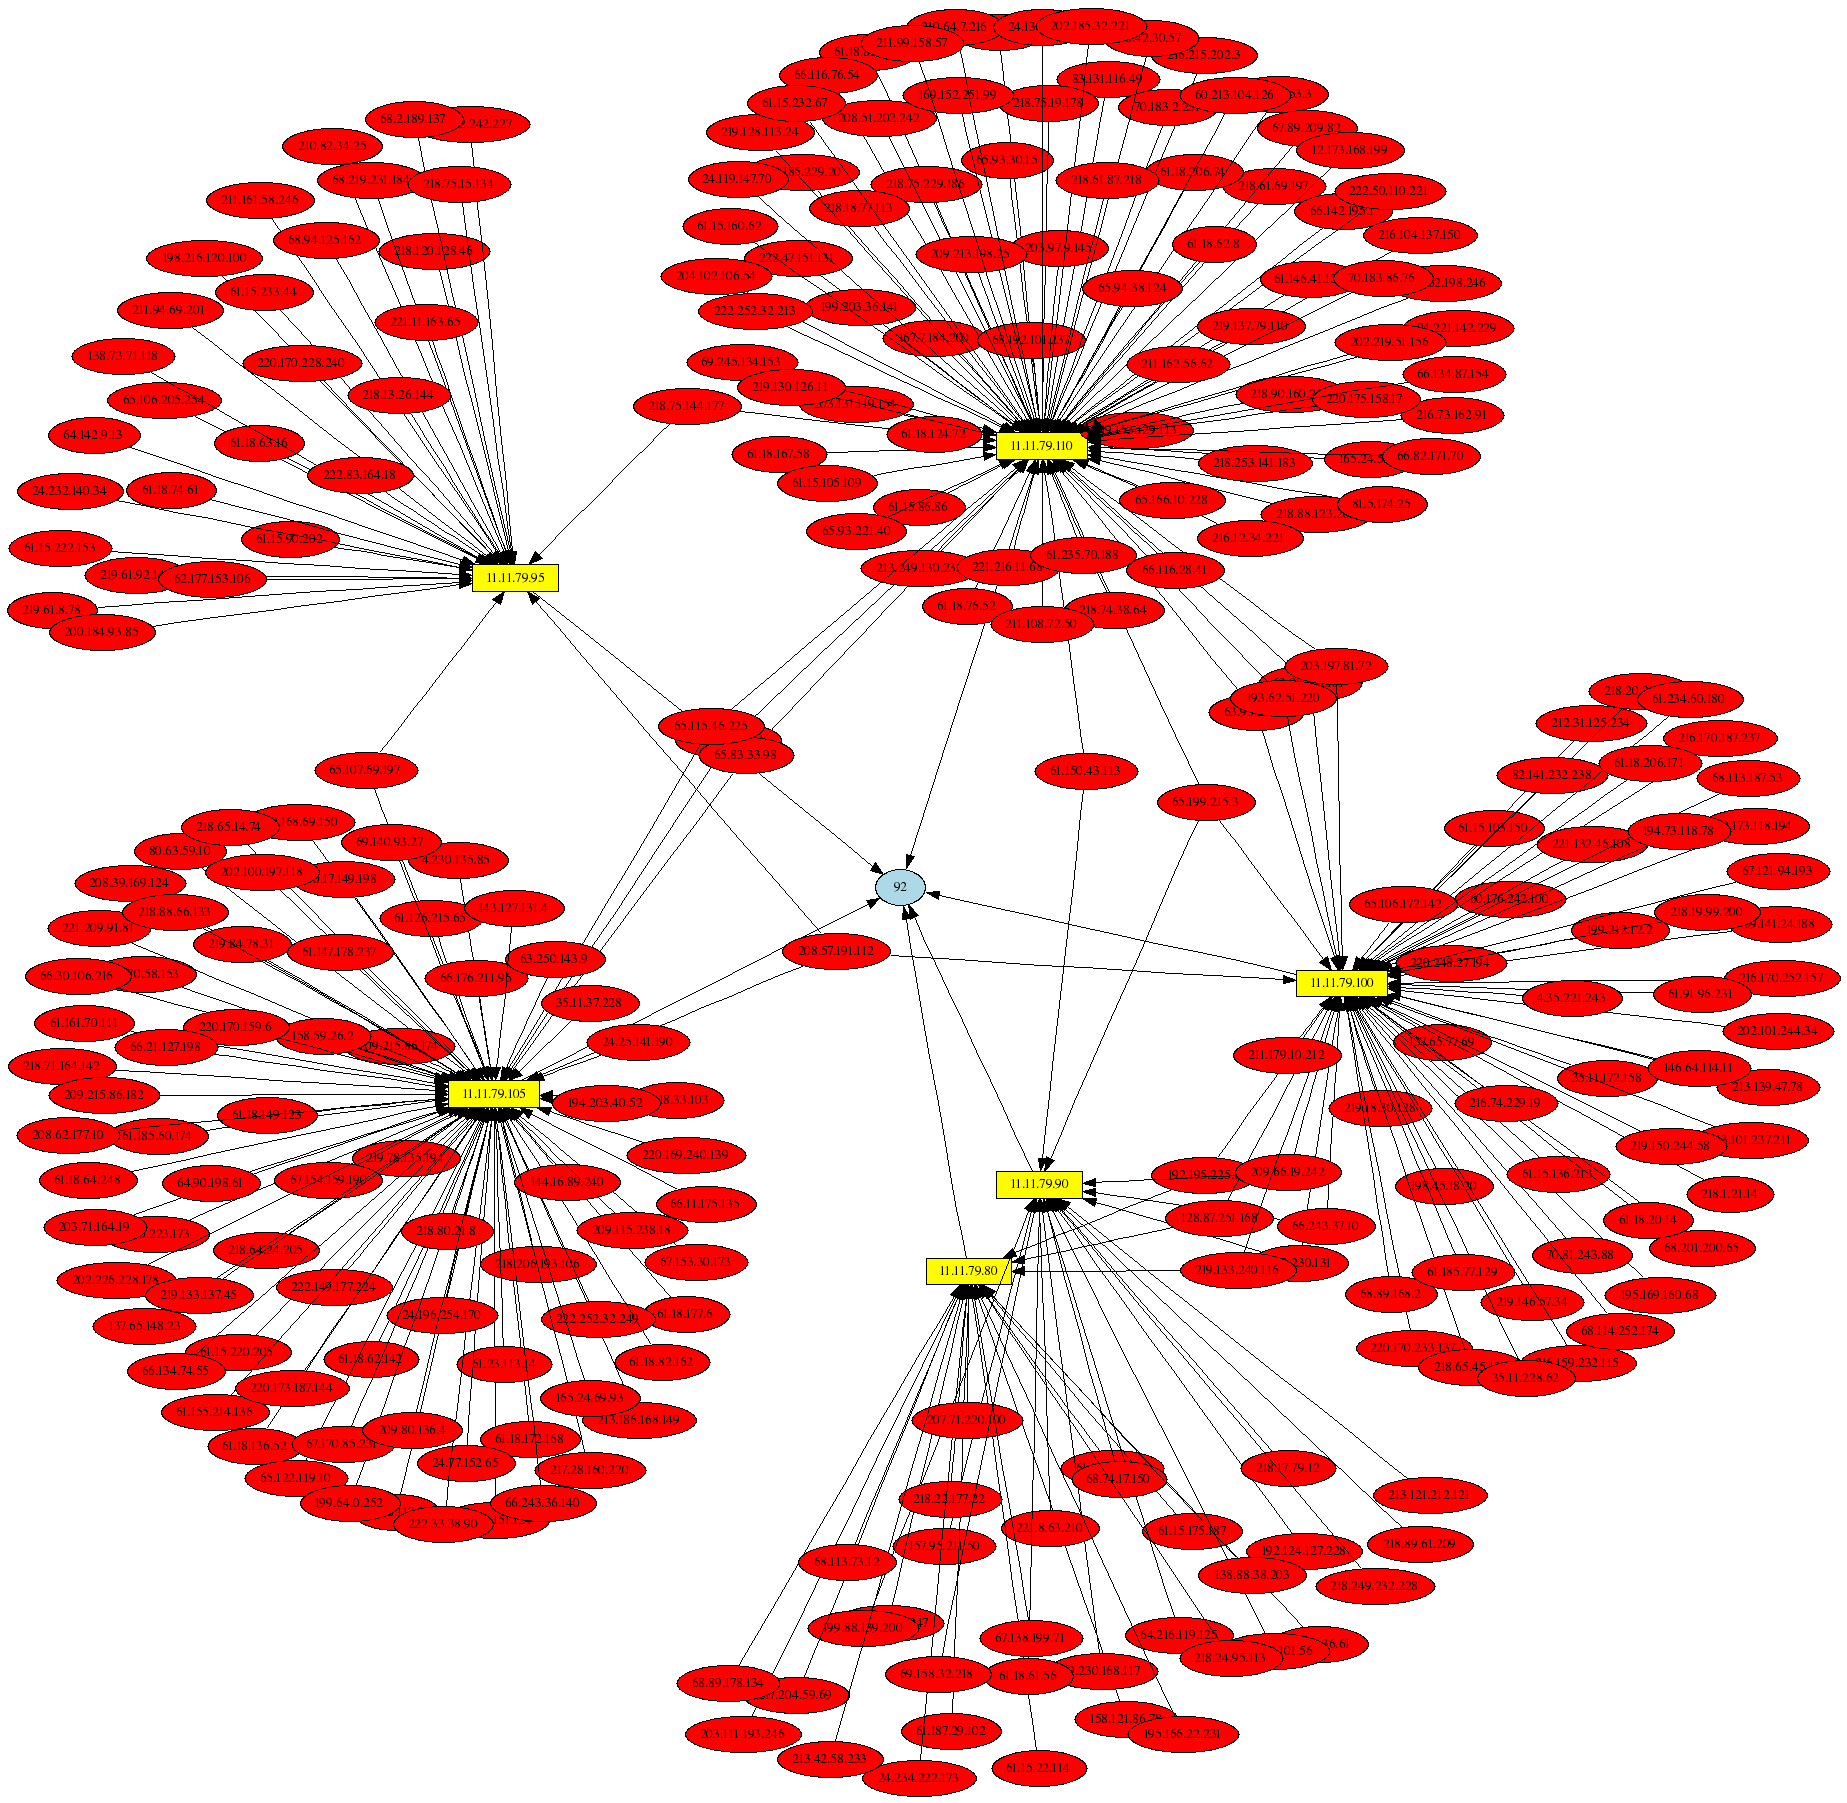
# psad --CSV -m iptablessyslog --CSV-fields "src dst ip_len:92" --CSV-max 300 \
--CSV-regex "PROTO=ICMP.*TYPE=8" | perl afterglow.pl -c color.properties |neato -Tgif -o nachi_worm.gif
RPC portmap scans
RPC has had a bad security record, and a few attempted connections to UDP port 111 were seen in the iptables logs:
# psad --CSV -m iptablessyslog --CSV-fields "src dst dp:111" --CSV-max 100  \
| perl afterglow.pl -c color.properties |neato -Tgif -o portmap_attempts.gif


